
The practice of creating money by bank lending (see How Banks Create Money) has a profound effect on the structure and function of the economy. This in turn, deeply affects the social structure and the power dynamics of any society trying to live under such an economy.
Burden of Debt
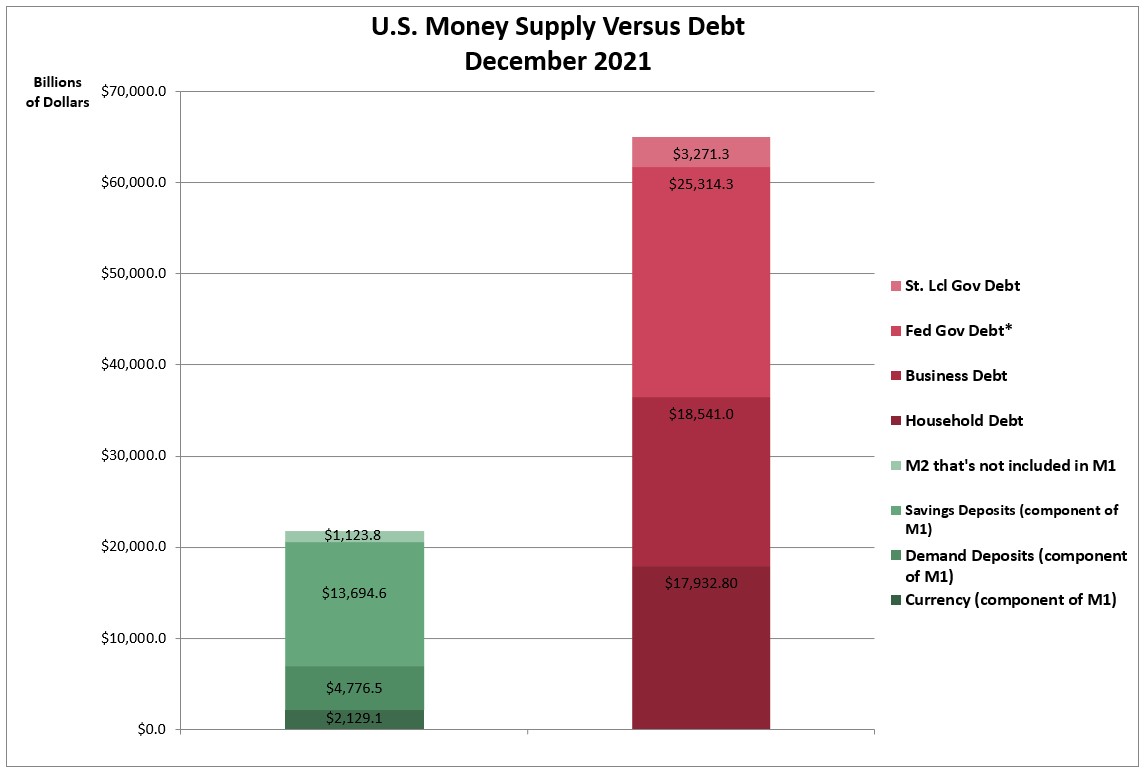
The bank-deposit portion of the US Money supply as of December 2022 was $17.6 trillion.1 All of it was created by lending, so all of it represents debt owed by somebody somewhere.
“Rather than banks receiving deposits when households save and then lending them out, bank lending creates deposits.”
Money Creation in the Modern Economy, Bank of England Quarterly Bulletin, 2014 Q1.
“Bankmoney is created when a bank enters previously non-existent currency units into a customer account.”
The Present Money System – Functioning, Dysfunctions and Future Perspectives, Joseph Huber, chair of economic and environmental sociology at Martin Luther University of Halle-Wittenberg, Germany
If we estimate a 5% average interest rate, it would mean the economy is burdened with 881 billion dollars in interest payments every year. And that’s just to rent the money supply that is needed to keep the economy functioning.
The bulk of the borrowing that creates our money supply is from home mortgages, business lending and student loans. The people paying the interest on these loans are saddled with the burden of paying the rent on the money that’s used by everyone in the whole economy. Everyone includes the hedge fund managers, and all the uber-wealthy on the Forbes billionaires list.
In reality the debt burden carried by the people and businesses in the working economy is far greater than the 17.6 trillion dollars that backs up the bank-account money. And the debt load has become more and more burdensome over the years, particularly in the last few decades. Combined business and household debt in the US as of December 2022 was over 38 trillion dollars.2 If we again estimate 5% interest, that’s 1.9 trillion dollars a year. Every year. Just for interest.
Flow of Money and Resources
The core dysfunction and unworkability of our existing monetary and economic structure creates an overall flow of money and resources that is completely contrary to what is commonly taught in economics texts. Since bank loans are generally converted into securities and sold to investors, the interest being paid on all the debt–that has to be carried to keep the economy supplied with money–is paid to both banks and investors. The beneficiaries are corporations or individuals that have enough extra money that they can afford to lend it or invest it.
Through the payment of interest, a constant flow of money and resources moves from the many, who can’t afford to buy a house, get an education, or run a business without borrowing, to the few who have more money than they need, and to corporations that exist solely for the purpose of making profits. The general flow is from producers to investors, from the poor and middle class to the wealthy.
In economics text books, the flow of money and resources is typically depicted as circular, as though it could, at least theoretically, function successfully and indefinitely. Like this:
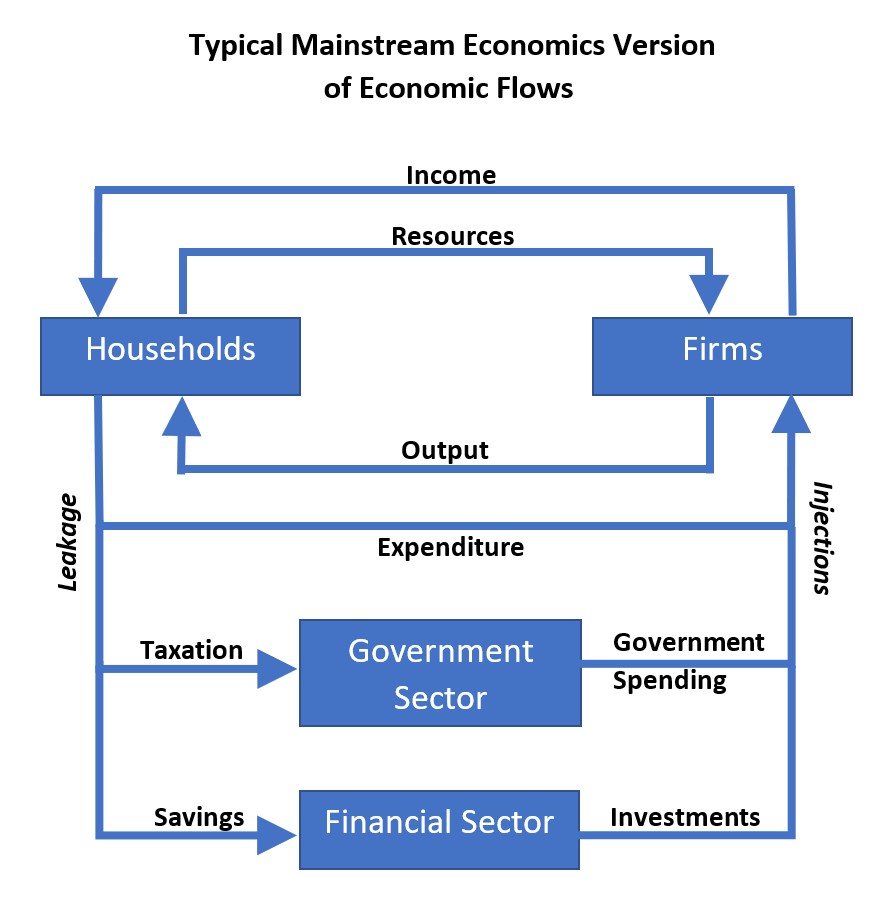
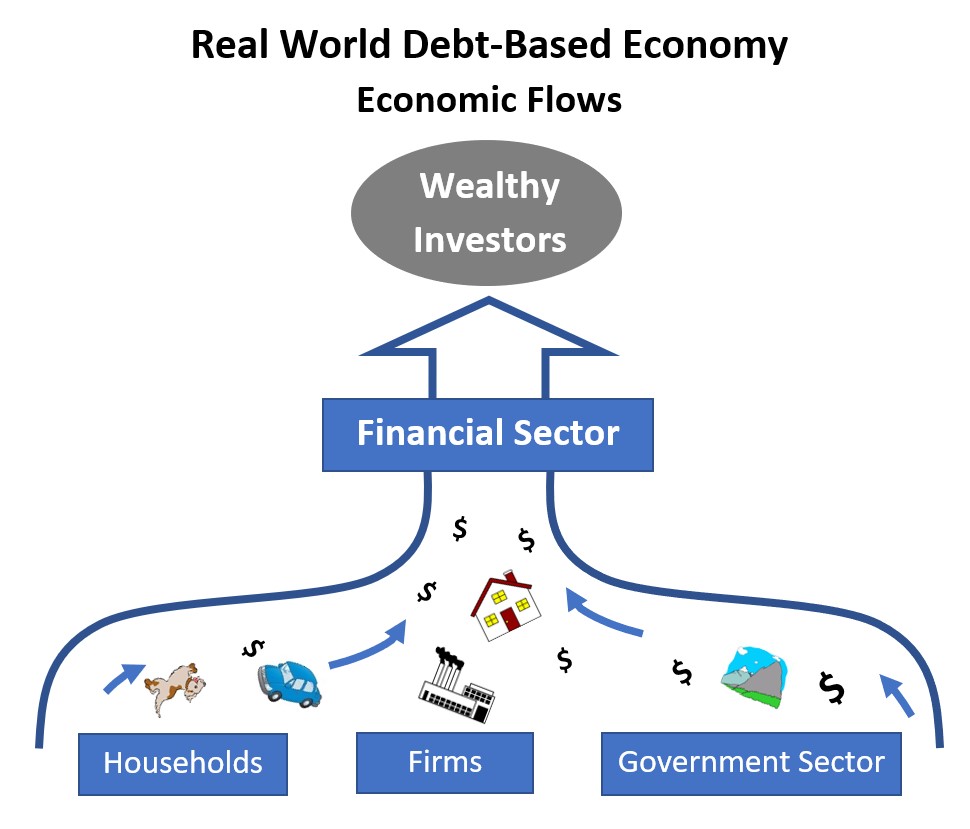
Notice how the financial sector in the diagram above is situated on the bottom as if it were a supportive foundation. But bear in mind that the purpose of investment is to make money itself earn money. No matter how much an investor invests, the amount they want and expect to come back to them will be more than that. There is a net transfer of money and resources generated by our economic system, and the flow is not circular. It’s vertical and it flows in one direction. More like this:
Concentration of Wealth
The evidence of our economy’s vertical money flow is clearly visible in the US economy and throughout the world.
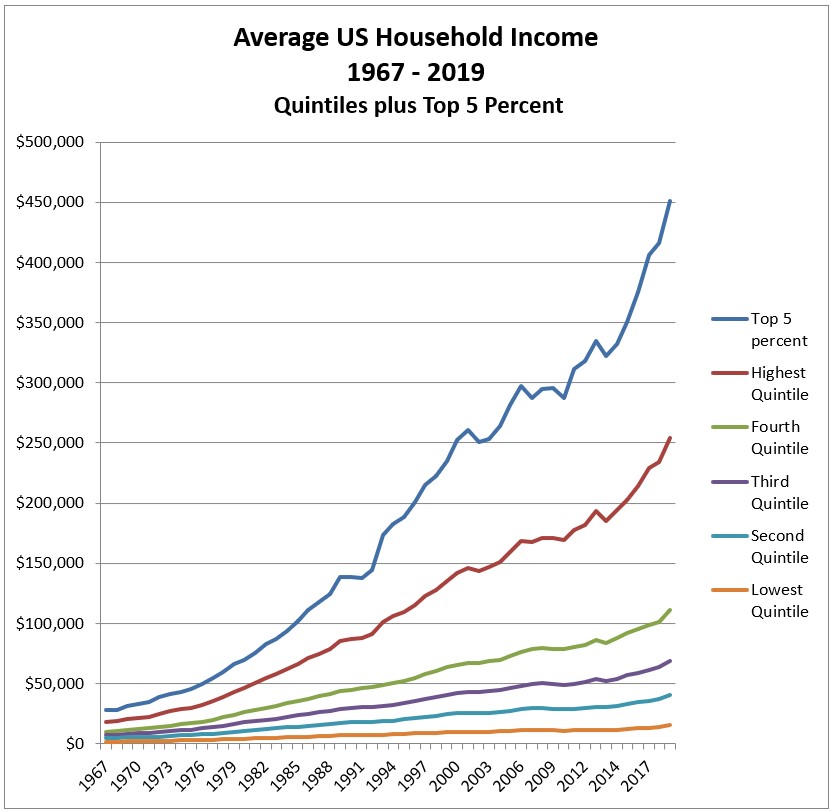
The graph below shows US Census Bureau statistics for household income from 1967 through 2019. The data plotted in the graph represent average incomes for segments of the population from lowest income to highest. Notice how the rise of the top lines gets steeper and keeps moving farther and farther away from the other lines.
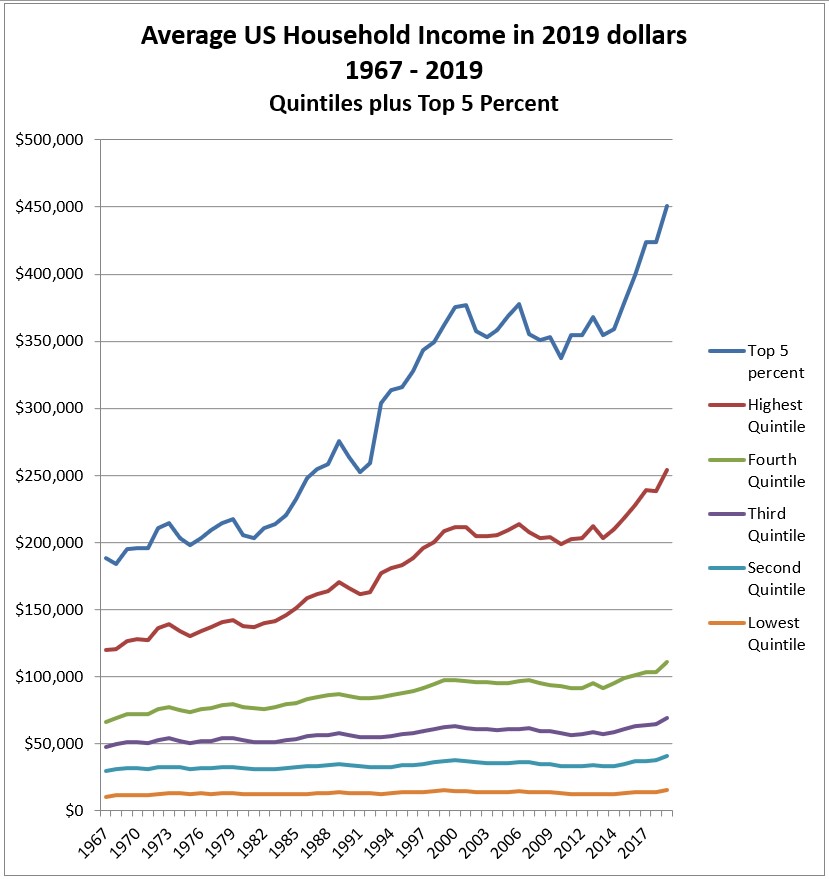
Taking the same figures and adjusting for inflation, we get the graph below. Notice the flatness of the lower lines. Real income gains show up only in the upper levels.
Another factor worth noting is that during the same period of time, debt has been growing at a much faster pace than income. If debt increases faster than income, financial viability may go down even though income is going up.
The graph below shows average net worth for US households as reported in the Federal Reserve Survey of Consumer Finance. (Net worth is the household’s assets, such as real estate and money in the bank, minus its debts.) Notice how far the top line is from the other lines.
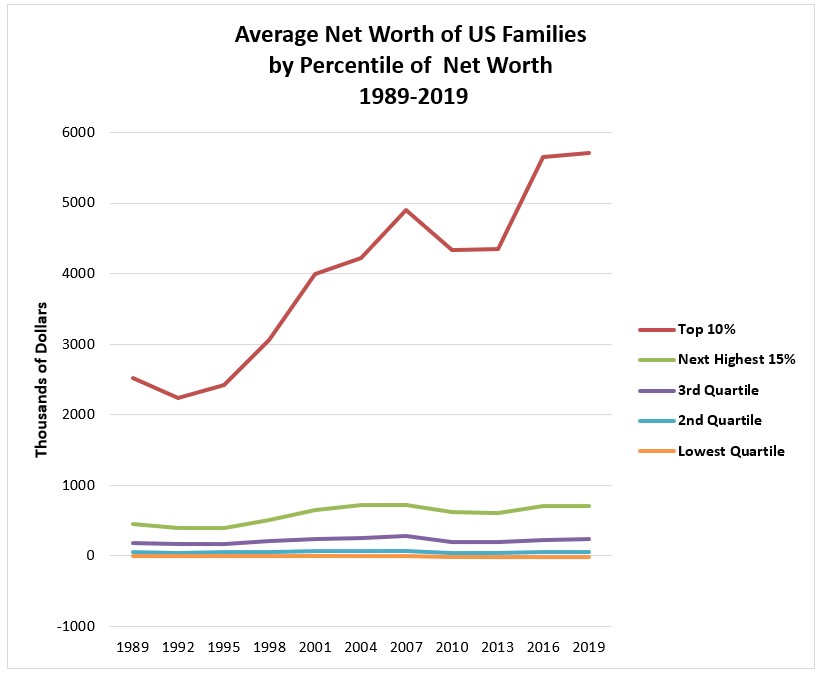
In the graph above, the lowest lines are made almost invisible by the scale required to show the top line. By stretching out the scale and showing only the bottom three quartiles in the graph below, we can make the slope of the lower lines visible. The top line on this next graph is $300 thousand rather than the $6 million at the top of the last graph.
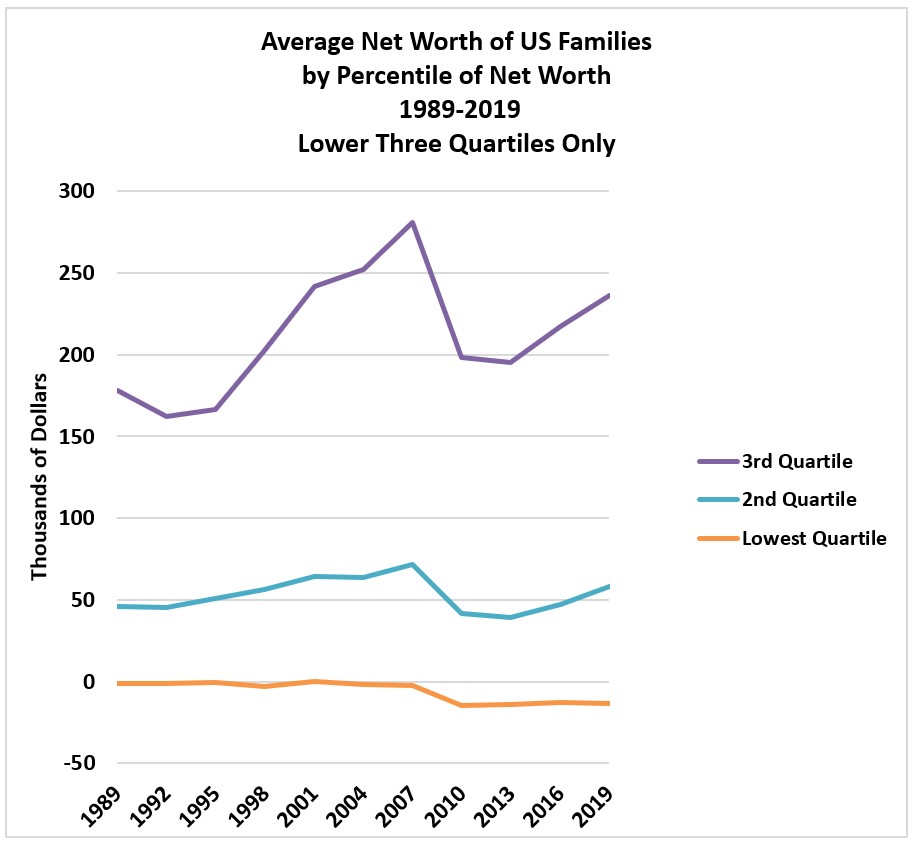
Note that the average net worth for the lowest level is below zero throughout most of the included time period. The boom that was happening in other sectors before the bust never touched that sector. But with the crash of 08, the net worth for that segment of the population went negative by about 12 to 14 thousand dollars. And it’s stayed there ever since. Also you can see that none of the lower levels have recovered from the crash. The only segment of the population whose net worth has risen above where it was before the crash is the top 10 percent.
The Cost of Being Poor
As shown here, we have far more debt in the US than we have money. In an economy that has more debt than money and can’t create money without increasing debt, it becomes next to impossible to function in it without borrowing.
At the same time, borrowing terms are based on the concept that lenders should be paid higher interest for taking greater risk, and risk assessment is based on perceived ability to pay. Therefore the more badly someone needs the money, the more expensive the loan will be.
At the top of the borrowing hierarchy are wealthy investors who get preferential terms and can use borrowing as leverage—meaning they use borrowed money to gain more money. In the middle are the mortgage borrowers, businesses, and students that qualify for loans from commercial banks and unknowingly create and fund the money supply. And then there is the bottom level—the ones working the lowest paid jobs, struggling to pay rent and feed their children.
If they can qualify for bank accounts and credit cards at all, the interest rates and fees are the highest. A small error in timing or calculation on their checking account and they can be stuck with returned-check fees of $30 or more per check. One late payment on a credit card, and the interest can jump to over 29%–indefinitely. If they don’t qualify for credit cards or bank loans and they have an emergency expense or can’t make ends meet, they may be driven to the payday lender.
Payday lenders typically charge between $15 and $30 per hundred dollars for loans that are due to be paid back in full within two to four weeks. That translates to an average of about 400% annual interest. In cases of default, where the borrower is unable to make the required payment on time, the balance can quickly grow to two or three times the original amount borrowed.
Annual revenue in the payday lending industry is over 18 billion dollars. Consider that all of that 18-plus billion in revenue is money extracted from working people who are sufficiently poor, desperate, and/or ill-informed that they resort to and tolerate the terms described above.
You might think that the lowest sector of the borrowing hierarchy is comparatively small, but it’s actually almost a third of the workforce. According to an Oxfam report released in March 2022, about 52 million US workers (31.9% of the workforce) are earning less than $15/hour. These are not teenagers just entering the job market—89% are 20 or older.
There are multiple factors that are pushing so many people into economic strangulation and making it so expensive to be poor in the modern United States. But providing a firm foundation for all the other factors is a money system that makes it impossible for the economy as a whole to have money without generating at least an equal amount of debt.
Where the Money Goes
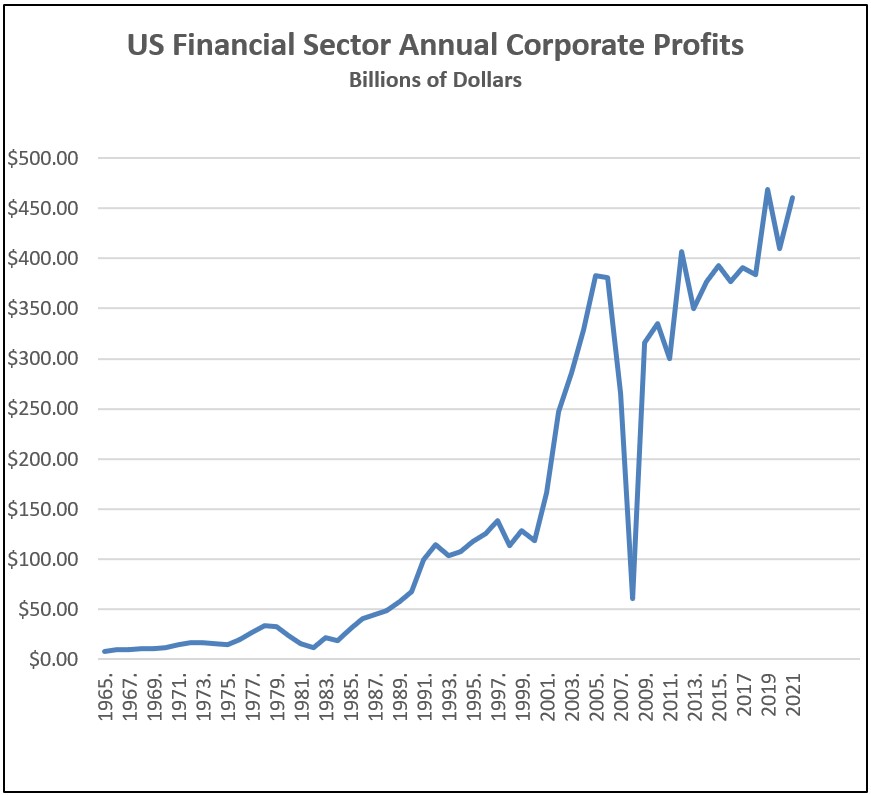
The graph below shows the trends in US corporate profits in the financial sector. That steep rise is what’s often referred to as financialization. You can also see the abuse of the system with the precipitous rise and then leveling off just before the crash of ’08.
If we look at financial sector corporate ownership of assets and equity, the picture is even more stark.
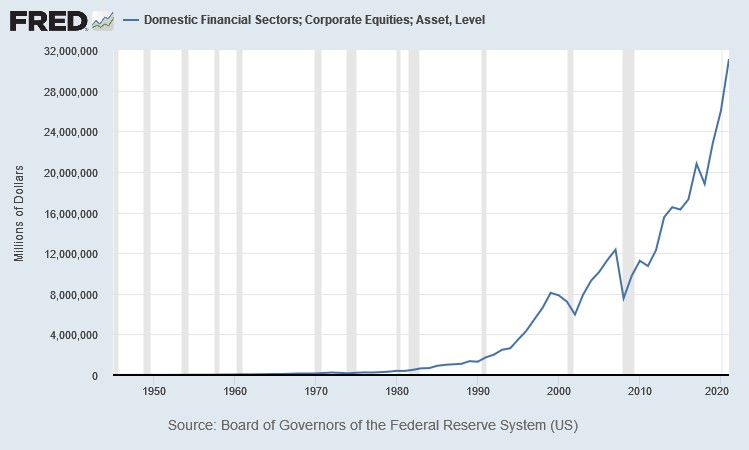
It’s also worth noting that as the extractive nature of the system and its boom and bust cycles build up financial wealth for upper-tier corporations and individuals, claim to the real wealth and resources of the planet is rising with it.
In the aftermath of the 2008 financial crash, millions of people lost their homes to foreclosure. Although subprime borrowers represented the majority in the beginning, by the time the Great Recession was deemed to be over, prime borrowers represented by far the largest percentage of foreclosures.3
On the other side of the same coin, as house sales and prices soared during 2021, over 18% of US homes sold during the fourth quarter of 2021were sold to investors.4
Now What?
The use of wealth and power to amass more wealth and power isn’t new to the world or new to the US. We are living in an age where that process has run rampant and it’s maxing out and threatening to destroy us. The system can present an illusion of workability for a while as long as most of the people remain in the working, struggling, interest-paying class, and the investor class remains a small minority. But by its basic structure, this system continually makes the upper levels more and more excessive and the lower levels more and more crushingly burdensome.
In addition to the moral and humanitarian objections to this sort of class structure and undemocratic power hierarchy, it is functionally unsustainable. And it’s begun to demonstrate that in more and more devastating ways. The longer it continues, the more it squeezes and crushes the lower levels—and it is the lower levels that are producing the goods and services people need to live their lives. The inevitable end of letting a system like this run its course is that the lower levels become so crushed and depleted that they cease to be able to produce anything, and the whole system collapses.
Before that actually happens, the lower levels tend to rise up and fight back, often instigating bloody revolutions that may well end up installing a similar or even worse hierarchy. Wouldn’t it be a good thing if humanity could get collectively smarter and work together to establish a system that would work for everyone? Something that would be sustainable and fair and non-destructive—maybe even creative and beneficial?
There are better ideas. There are better ways to think about money and economics. There are better ways to do this.
See Also:
- How the Banking System Works
- How Banks Create Money
- How the Debt-Based Money System Works (and doesn’t work)
- The Fairy Tale of Endless Growth
References:
- 1Federal Reserve Statistical Release, H6: Money Stock Measures
- 2Federal Reserve Statistical Release, Z1, Financial Accounts of the United States
- 3NBER: US Foreclosure Crisis Was not Just a Subprime Event
- 4Redfin News: Real Estate Investors are Buying a Record Share of U.S. Homes
- Average household income statistics from US Census Bureau historical figures: https://www.census.gov/data/tables/time-series/demo/income-poverty/historical-income-households.html
- Average household net worth statistics taken from the Survey of Consumer Finance (SCF) Chart Book of the Federal Reserve Survey of Consumer Finance last updated September 2020. The SCF is conducted every three years. The next updates are expected in late 2023.
- Financial sector annual corporate profits statistics taken from a compiled table released in January 2017 by the US Bureau of Economic Analysis (BEA), plus updated figures for succeeding years from tables released in March 2019, and March 2022.
- Financial sector assets graph from: https://fred.stlouisfed.org/series/FBCETTA027N
Last updated: April 26, 2023